New Orleans Real Estate 2018 Recap
A look back at 2018 single family home sales in New Orleans LA. How did the market shift in 2018? We take a look here.
Number of New Listings
- 2014: 4521
- 2015: 4740
- 2016: 4687
- 2017: 4894
- 2018: 4998
The number of new listings was up just over 100 properties, a small increase in the available number of homes for sale.
Median Sold Prices
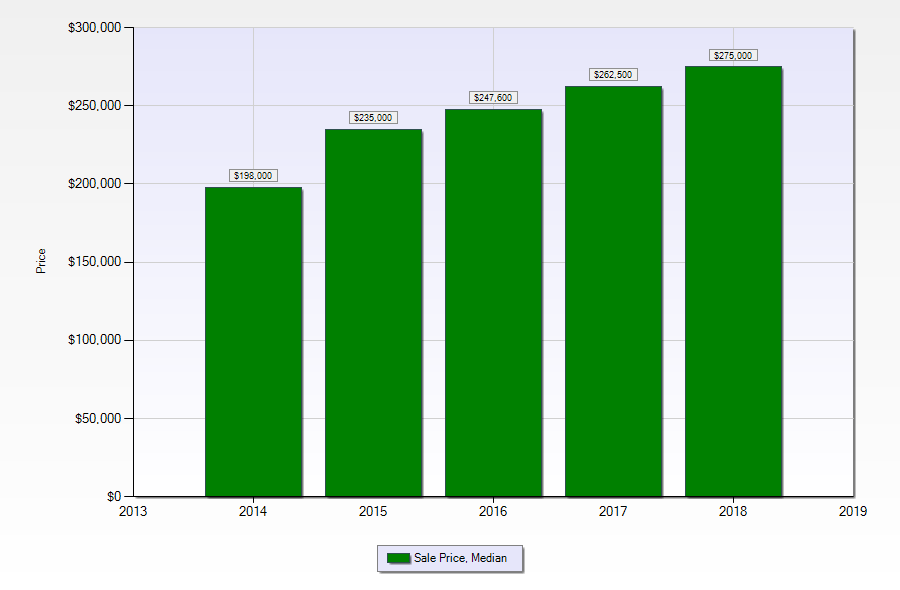
Median sold prices jumped around from month to month, as is to be expected, but ended the year at $275,000, up from $262,500 in 2017. This continues the 5 year trend of increasing prices in the city.

Number of Homes Sold
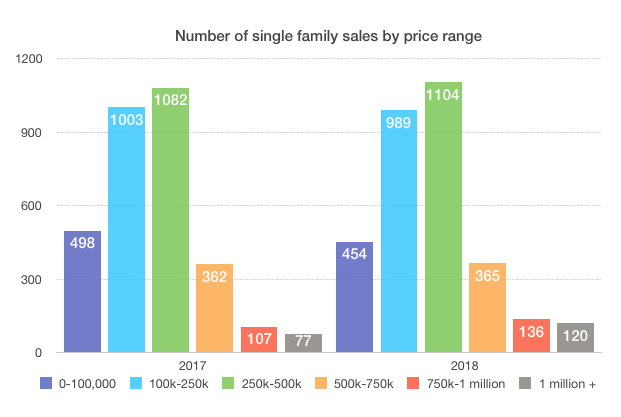
The most interesting part of 2018 was the shift in the number of sales within each price range. Affordably priced properties continue to be harder to find, resulting in yet another year of lower sales in the under $250,000 range. Luxury sales have continued to increase, ending the year up in both the $750k-$1million and the over $1 million ranges. Those new downtown condos are having an impact on the numbers, to be sure.

Average Days to Sell
Believe it or not, it took 10 less days on average to sell a New Orleans home in 2018 (65) than it did in 2014 (75). Those stories you’re hearing about the market slowing down are completely dependent on what neighborhood and price range a home is in.
Expired listings
As the number of homes sold has increased, so have the number of homes that were unsuccessfully listed for sale. In 2018, over 5,000 homes were listed for sale and expired without selling, up slightly from 4,979 in 2017.
Months of inventory
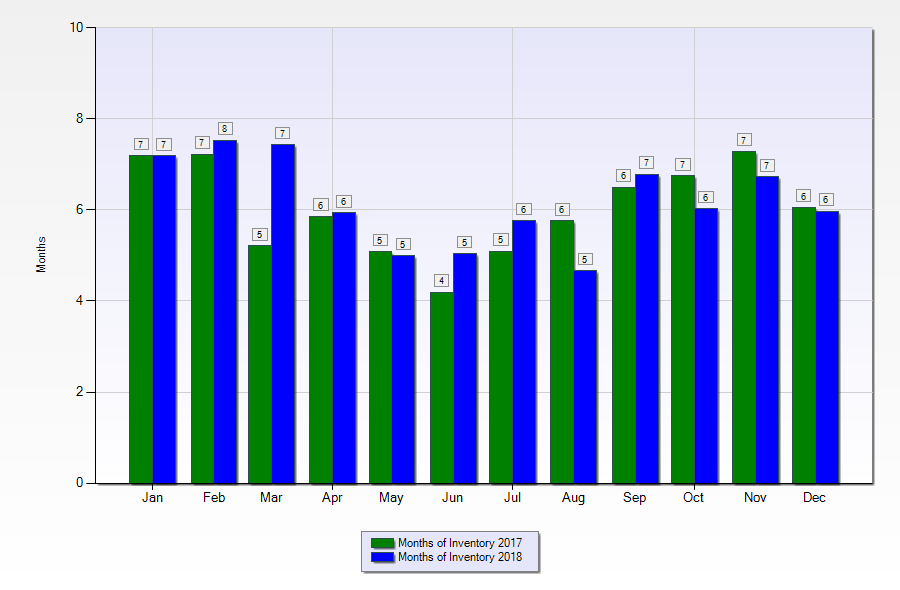
In 2018, the amount of inventory ranged from a high of 7 months to a low or 5 months, with little change from month to month. As you can see, inventory was basically the same as in 2017.


